Most traders have rules. Fewer can say how often they follow them. A scored checklist fixes that. Answer a few yes-or-no questions for every trade, add up the yes answers, and over a few weeks you can see whether following your rules pays.
Download the checklist template (CSV)Opens in Excel, Google Sheets or LibreOffice. One example row; replace it with your trades.
Why score a checklist
A trade can follow every rule and lose, or break three rules and win. If you only look at profit, you end up rewarding the lucky rule-breaks and doubting the good losses. A score keeps process and outcome in separate columns, so you can judge each on its own.
Pick rules you can answer at the time
Choose three to six rules. Each one has to be a yes or a no you can answer when you take the trade, not something you can only judge afterwards. For example:
- Plan: was the trade planned before entry?
- Setup: does it match a setup in your playbook?
- Risk: was the stop set before entry, and was the risk within your limit?
- Timing: did you wait for your trigger, for example a candle close?
"Was it a good trade?" is not a rule; it's a verdict. "Did I wait for the candle to close?" is a rule.
The template
One row per trade, with these columns:
- Date, symbol, setup and direction.
- One column per rule, answered Y or N.
- Score: the number of Y answers.
- Risk in money, result in money, and result in R (result ÷ risk).
- Notes.
The download includes a score formula, =COUNTIF(E2:I2,"Y"), and an R formula, =L2/K2. Copy both down as you add rows.
Score each trade
Fill in the rules when you enter the trade or straight after, while you still remember why you took it. The score is just the count of Y answers: 5/5 means every rule was followed. Don't change answers after you see the result; that's the bias the checklist is there to catch.
Read the results
Example data Eight made-up trades, scored on the five rules above.
| Trade | Plan | Setup | Stop | Risk | Waited | Score | Result (R) |
|---|---|---|---|---|---|---|---|
| 1 | Y | Y | Y | Y | Y | 5 | +2.0 |
| 2 | Y | N | Y | Y | N | 3 | −1.0 |
| 3 | Y | Y | Y | Y | Y | 5 | −1.0 |
| 4 | Y | Y | Y | Y | N | 4 | +1.2 |
| 5 | N | N | Y | Y | N | 2 | −1.0 |
| 6 | Y | Y | Y | Y | Y | 5 | +1.8 |
| 7 | Y | Y | Y | N | N | 3 | +0.5 |
| 8 | Y | Y | Y | Y | Y | 5 | +1.0 |
Three questions to ask of a table like this:
- How often do I follow every rule? Here, 4 trades out of 8 scored 5/5: a 50% compliance rate. Track it week by week. It often improves faster than profit does.
- Does following the rules pay? The four 5/5 trades averaged +0.95R. The other four averaged −0.08R. Eight trades prove nothing, but over a few months this comparison is the most useful one in your journal.
- Which rule do I break most? "Waited" was skipped on 4 of 8 trades. That's the rule to work on first, or to rewrite if it doesn't fit how you trade.
Trade 3 followed every rule and lost. Trade 7 broke two and won. Both are normal. Judge trade 3 as a good trade with a bad outcome, and trade 7 as the opposite.
Common mistakes
- Too many rules. Past six or so, people stop filling them in. Start with three.
- Rules you can't check in the moment. "Market was trending" is judged with hindsight. "Price was above the 200 EMA" can be checked.
- Scoring only the losers. Score every trade, or the comparison between full and partial scores is meaningless.
- Changing the checklist every week. Keep it fixed for at least a month before you judge it.
Building it in JouView
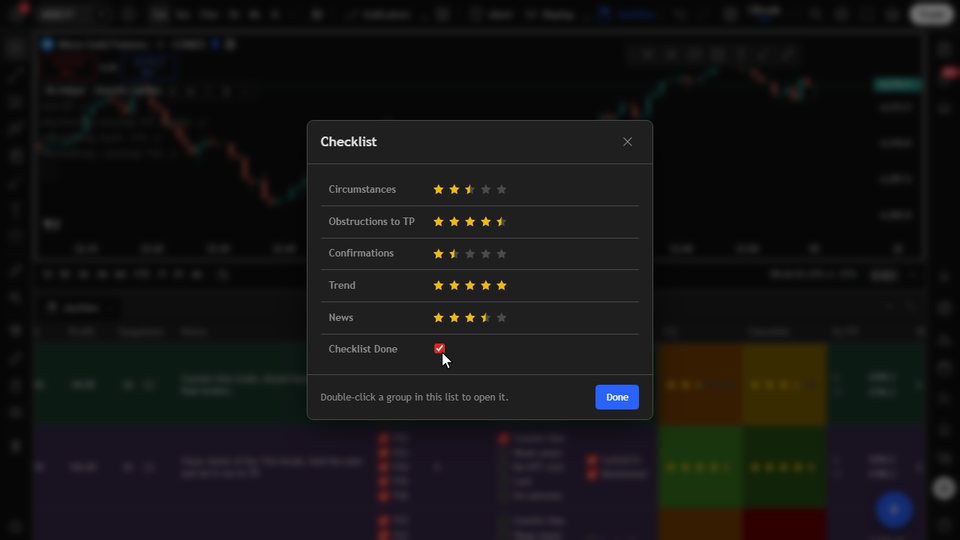
In JouView, the checklist can live on the journal row under your TradingView chart. Make each rule a yes/no or star-rating column, pack them into a group so they open as one popup, and add a score formula such as:
([Planned] === "true" ? 1 : 0) + ([Setup] === "true" ? 1 : 0) + ([Waited] === "true" ? 1 : 0)
A style rule can then color each row by its score. Groups and custom columns are part of the Explorer and Trader plans; see checklists in JouView.